

The majority of investors rely solely on fundamental analysis to evaluate stocks for investment. Though fundamental analysis examines various aspects of stocks in order to evaluate them for long-term investment. However, combining fundamental and technical analysis will improve accuracy and will determine when an investor should invest in a stock. As a result, the fundamental analysis combined with technical analysis is a lethal combination in terms of making sound investment decisions.
If we talk about weightage, then the fundamental analysis will have far more weightage than the technical analysis. The reason being we are going to use technical analysis only to mark the entry in the particular stock. Filtering of stocks will be solely done on the basis of fundamental analysis.
Here in this article, we will take an example of a stock named Powergrid Corp, we will analyze it from a fundamental point of view, and then after passing the fundamental test we will look for an entry by using technical analysis tools. Let’s go further.
Fundamental Analysis
Let’s discuss the financials of the company
Financial Analysis
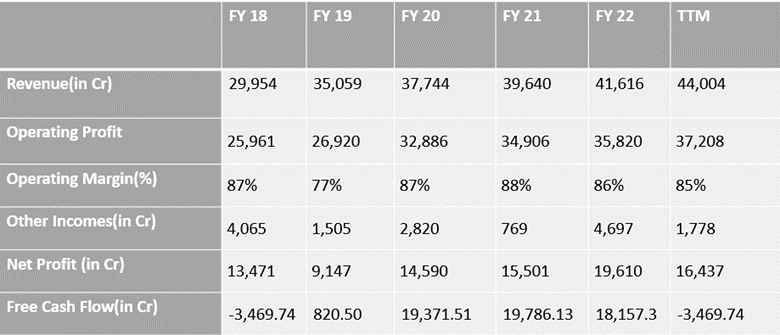
- Revenue growth: At the very step in the fundamental analysis the company’s revenue growth is assessed. If we look at the revenue of the company it has shown significant growth of about 50% in the span of 5 years that is from FY18 to FY23. This states that the company is achieving consistent growth in its revenue.
- Operating Margin: The next thing to look for is the operating margin of the company. It indicates whether the company is able to minimize its expenses by generating enough profit margin.Company is maintaining a high operating margin of 85% on average. This shows that the company’s expenses are lower as compared to the revenue. Which is a positive sign.
- Net Profit Growth: The next major parameter is the net profit growth. It is expected that the company’s revenue growth and the Net profit growth should correlate, but in most cases the company lags behind in generating enough Net profit margin. If we look at PowergridThe growth in revenue does not correlate with the growth in net profit and the reason behind this contradictory growth is high depreciation and Interest charges.
| FY18 | FY19 | FY20 | FY21 | FY22 | TTM | |
|---|---|---|---|---|---|---|
| Operating Profit | 25,961 | 26,920 | 32,886 | 34,906 | 35,820 | 37,208 |
| Interest | 7,324 | 8,737 | 9,509 | 8,135 | 8,036 | 9,249 |
| Depreciation | 9,231 | 10,541 | 11,607 | 12,039 | 12,872 | 13,298 |
| Net Profit | 8,204 | 10,034 | 11,059 | 12,036 | 16,824 | 15,253 |
Since, the Power sector is highly capital intensive and their asset requirement is high, they mainly raise funds through debt, as a result they are liable to pay huge interest and have to bear depreciation cost..
Free Cash flow: This signifies whether the company is generating enough cash from its operating activities. If we look at power grid since its a capital-intensive business involving huge infrastructural growth fluctuations in cash flow is very common in such industries. But still, the company has shown enormous growth in FY22 if compared to FY22.
Ratio Analysis
After analyzing the financial statements of the company, it’s time to analyze key financial ratios to have a broader view of the company’s position.
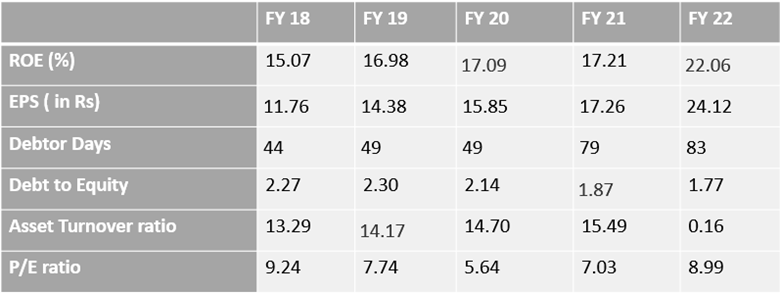
Return on Equity: This is the crucial parameter on which an investor gives more weightage. The ROE of the company determines the value or returns it provides to its shareholders. If we look at the ROE of Powergrid Corp. it has shown significant growth in the span of 5 years.
Price to earning ratio: This ratio determines the valuation of the company, It states whether the company is undervalued or overvalued. In the case of Powergrid corp. Company’s P.E. ratio indicates that the company has been valued effectively and has huge growth potential. P.E. ranging from 10 to 20 is considered good.
Asset Turnover Ratio: It is the ratio of net sales to total assets. It measures the efficiency at which the assets of the company are being used. The asset turnover ratio of the power grid corporation has sharply declined from 15.49 in FY21 to 0.16 in FY23. The reason being enormous buying of assets by the company for its developmental projects.
Debt to Equity ratio: It is the most important parameter as it sates the structure of company finances. Generally in capital intensive businesses funds are raised through debts. But its effects are not much if the company has the ability to pay its debt . In case of Powergrid corporation the company in spite of being capital intensive has managed to limit itself to 1.77, Which is somewhat above the ideal condition of <1.
Point of View
After deeply analyzing the company’s financials with the help of ratios. We can conclude that since the company is in the power sector it has huge growth potential. Apart from this company has shown consistent revenue growth along with that it undertakes several developmental projects.
The company in spite of being capital-intensive still its D/E ratio is lower than many capital-intensive businesses. The company has been valued low if compared to its future potential. The company has maintained its operating margin outstandingly. This makes it to pass the Fundamental Test.
Also Check: How to select stocks in swing trading?
Technical Analysis: For Entry
After passing the fundamental test, it is clear that the company is investible. But the common question arises in the minds of every investor regarding what’s the right to invest. Technical analysis has an answer. Let’s see how.
Monthly timeframe
In the very first step we should analyze the chart in the monthly time frame. Since we are entering into the stock for the long term. Therefore longer the time frame more accurate would be the entry.
Identification of Market Structure
In the monthly time frame, first we should look for the trend in which a company’s stock price is moving. If the stock is in an uptrend it will form a pattern of Higher Lows and Higher Highs and if it is in a downtrend it will form Lower Lows and Lower Highs.
If we look at the chart of Powergrid it is forming a Higher low and Higher highs pattern which denotes an uptrend.
Identifying the market pattern
Next thing we should look for the market pattern. If we look at the market structure of powergrid we could observe that the stock is forming a pullback after attaining its all time high. It is in the process of pullback which is the right time to enter into a stock.

Looking for a level to enter
As the pullback is the right time to enter and the best time is when it shows a reversal In order to find that we will use fibonacci retracement tool and 50 or 200 EMA.
0.5 level in the Fibonacci acts as a major support or resistance level. The chances of reversal in the level are high. In Powergrid there we can see an intersection of 0.5 fibs with 50 EMA. Which makes that zone a buying zone for the investor. As there are higher chances for the price to reverse into an impulsive move from that level.
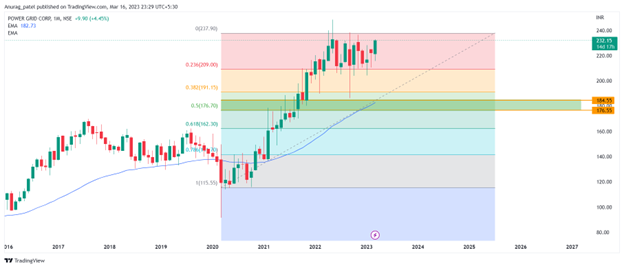
Therefore, in the Powergrid the best time to buy is when the price reaches the range of 175 to 185.
Final Words
So, combining both fundamental and Technical analysis gives investors an extra edge over others. Finding the best stock is only the half journey and it completes when we find the right time to enter.
Also check these below articles we have done some fundamental analysis on the popular companies.


