

One of the main reasons why most of traders experience losses is that they are well versed in the term called technical analysis. Which one of us, fellow traders and investors, haven’t heard of a head and shoulders figure, resistance shifting to support, or bullish divergence? True, we’ve all heard of it, but what unifies this situation? These sources are all considered to be a component of technical analysis.
Chart patterns are an important part of technical analysis, but they must be learned before they can be used effectively. In this article, we are going to talk about a specific chart pattern named as double top or double bottom chart pattern.
What are Chart Patterns?
Chart patterns are distinct forms on a price chart that technical analysts employ in stock trading. A sequence of trendlines or curves is used to identify the trends. Chart patterns are the foundation of technical analysis and necessitate a trader’s understanding of both what they are looking at and what they are looking for.
Types of Chart Patterns
There are two main types of Chart Patterns
1. Continuation Chart Patterns
Continuation chart patterns indicate that the present trend on the chart will continue. The pattern departs in the direction of the movement that preceded its development. A continuation pattern in a bearish trend implies that the bearish movement will continue. In a positive trend, the pattern indicates that the bullish momentum will continue.
Continuation chart patterns enable the asset to consolidate the existing trend movement without calling it into doubt. These patterns appear frequently on pricing charts. Continuation patterns indicate entry points to capitalize on the trend, but don’t be too quick; regardless of how much consolidation there is inside the pattern, it is advisable to wait for a signal suggesting the trend’s resumption before initiating a position.
Examples of Continuation Chart Patterns
- Triangles( Ascending, Descending and Symmetrical)
- Flags (Bullish and Bearish)
- Pennant (Bullish and Bearish)
- Wedges
2. Reversal Chart Patterns
Reversal chart patterns signal a change in the current trend. The exit of the pattern is theoretically in the opposite direction of the movement before the construction of the chart pattern. A reversal pattern indicates a bullish movement in a bullish trend. In a bearish trend, however, it also heralds a bullish movement.
It is critical not to predict the pattern’s end. Only when the price line departs the pattern (breakage of the neck line or the bearish downward/bullish upwards slant) is a reversal chart pattern verified. A chart, for example, may display a double bottom, but this reversal chart pattern might be turned into a triple bottom or a range, necessitating the need to wait for the bullish/bearish signal.
Examples of Reversal Chart Patterns.
- Head and Shoulders Pattern
- Double tops and Double bottoms
Double Tops and Double Bottom Patterns
As discussed above Double Tops and Double Bottoms are most of the time work as a Reversal Chart Pattern. Further in this article we are going to discuss both of them one by one.
Double Top Pattern
A bearish reversal chart pattern generated after an uptrend is a double-top pattern. This double-top design is made by two peaks rising above a support level known as the neckline. After a strong rise, the initial peak is produced, followed by a retracement back to the neckline.
After returning to its neckline, the price turns bullish and rises once more to build the second peak. This pattern is finished when the prices return to the neckline after establishing the second peak. The bearish trend reversal is confirmed when prices break through the neckline or support level.
How to read it?
1. Look for the Uptrend
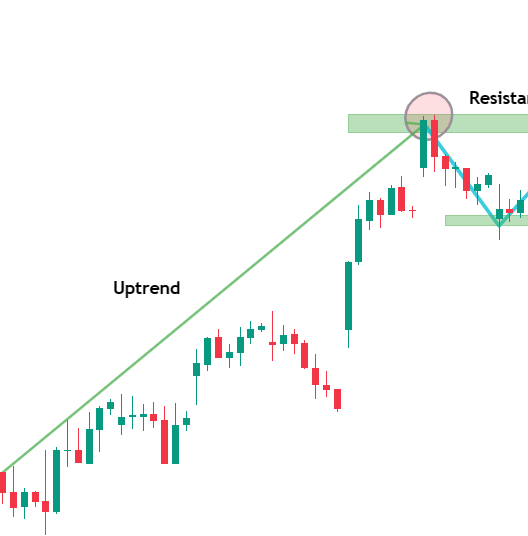
As discussed above, double top pattern marks the end of an uptrend, therefore looking for the uptrend will take you to the formation of the double top pattern.
2. Look for the resistance

The second step that one should follow in order to read a double top pattern is to find the resistance. Resistance is the level based on which the pattern is formed.
3. Two Tips
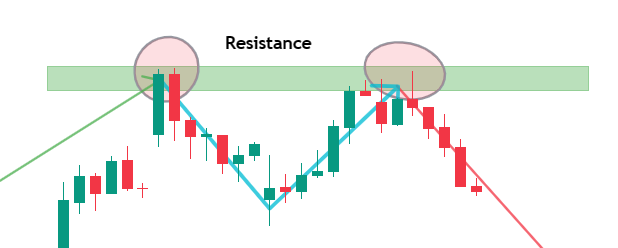
After finding out the resistance look for the two tips or the formation of the M patttern
4. Trade on the breakdown of Neckline
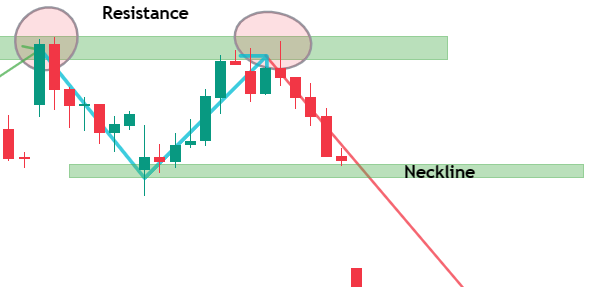
After getting the confirmation of the pattern, wait for its neckline to break and then execute your trade and keep the stop loss above the neckline, enjoy the downtrend.
Double Bottom Pattern
The double bottom pattern, which consists of two low points emerging around a similar horizontal price level, indicates a potential bullish reversal signal. A measured price increase will occur between the two low points, indicating some support at the price lows.
The double bottom chart pattern, which resembles the letter “W,” appears at the end of a downtrend and at the same time it marks the start of the Uptrend.
How to read it?
1. Look for the Downtrend
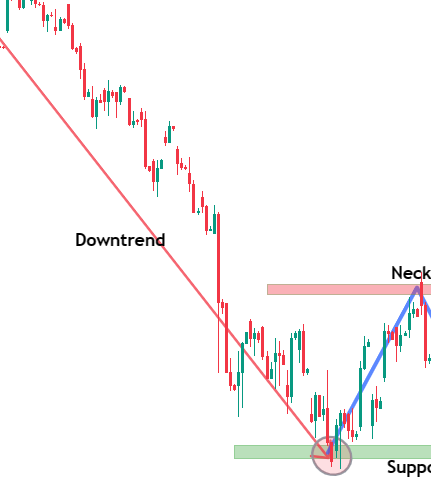
As discussed above, the double bottom pattern marks the end of a downtrend, therefore looking for the downtrend will take you to the formation of the double bottom pattern.
2. Look for the support
The second step that one should follow in order to read a double bottom pattern is to find the Support. Support is the level based on which the pattern is formed.
3. Two tips
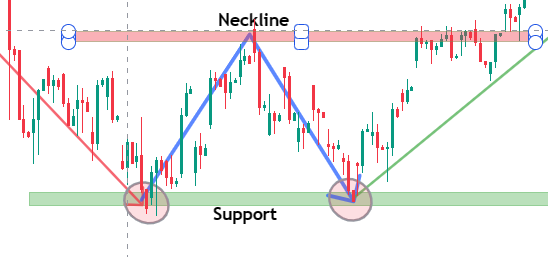
After finding out the Support look for the two tips or the formation of the W pattern.
4. Trade on the Breakout of Neckline
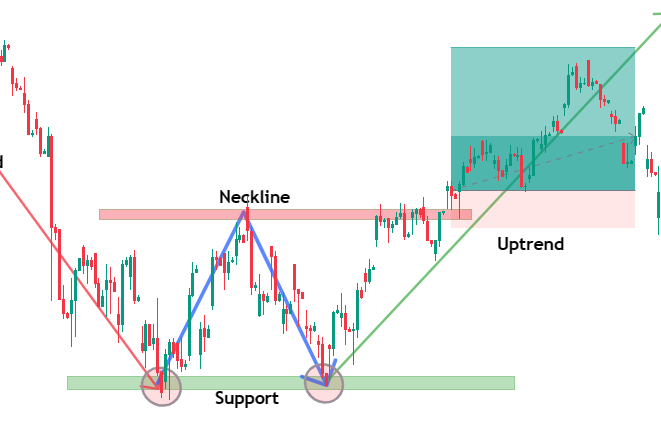
After getting the confirmation of the pattern, wait for its neckline to break and then execute your trade and keep the stop loss below the neck line, enjoy the uptrend.
Conclusion
A double bottom pattern, like any other chart pattern employed in technical analysis, is not guaranteed to work and is always up to individual interpretation. Learning how to trade a double bottom pattern takes practice because not every price pattern that arises will succeed.
To validate a pattern and identify false signals, make sure all conditions are met, such as a severe bearish slide before the first bottom and increasing trading volume at the second peak.


